Three-Pane Trace Evaluation (eval_trace)
The eval_trace display splits one agent trace into three synchronized panes (Reasoning, Function Calls, and Final Answer) so an evaluator sees what the agent thought, did, and produced at a glance. Built for continuous evaluation.
The eval_trace display splits a single agent trace into three synchronized panes: Reasoning, Function Calls, and Final Answer. An evaluator sees what the agent thought, what it did, and what it produced side by side, which suits continuous evaluation where new traces arrive and must be judged quickly.
Unlike a vertical agent-trace display that stacks an interleaved trace in one column, eval_trace decomposes one trace into its three semantic components, so the structure of the agent's behavior is visible without scrolling.
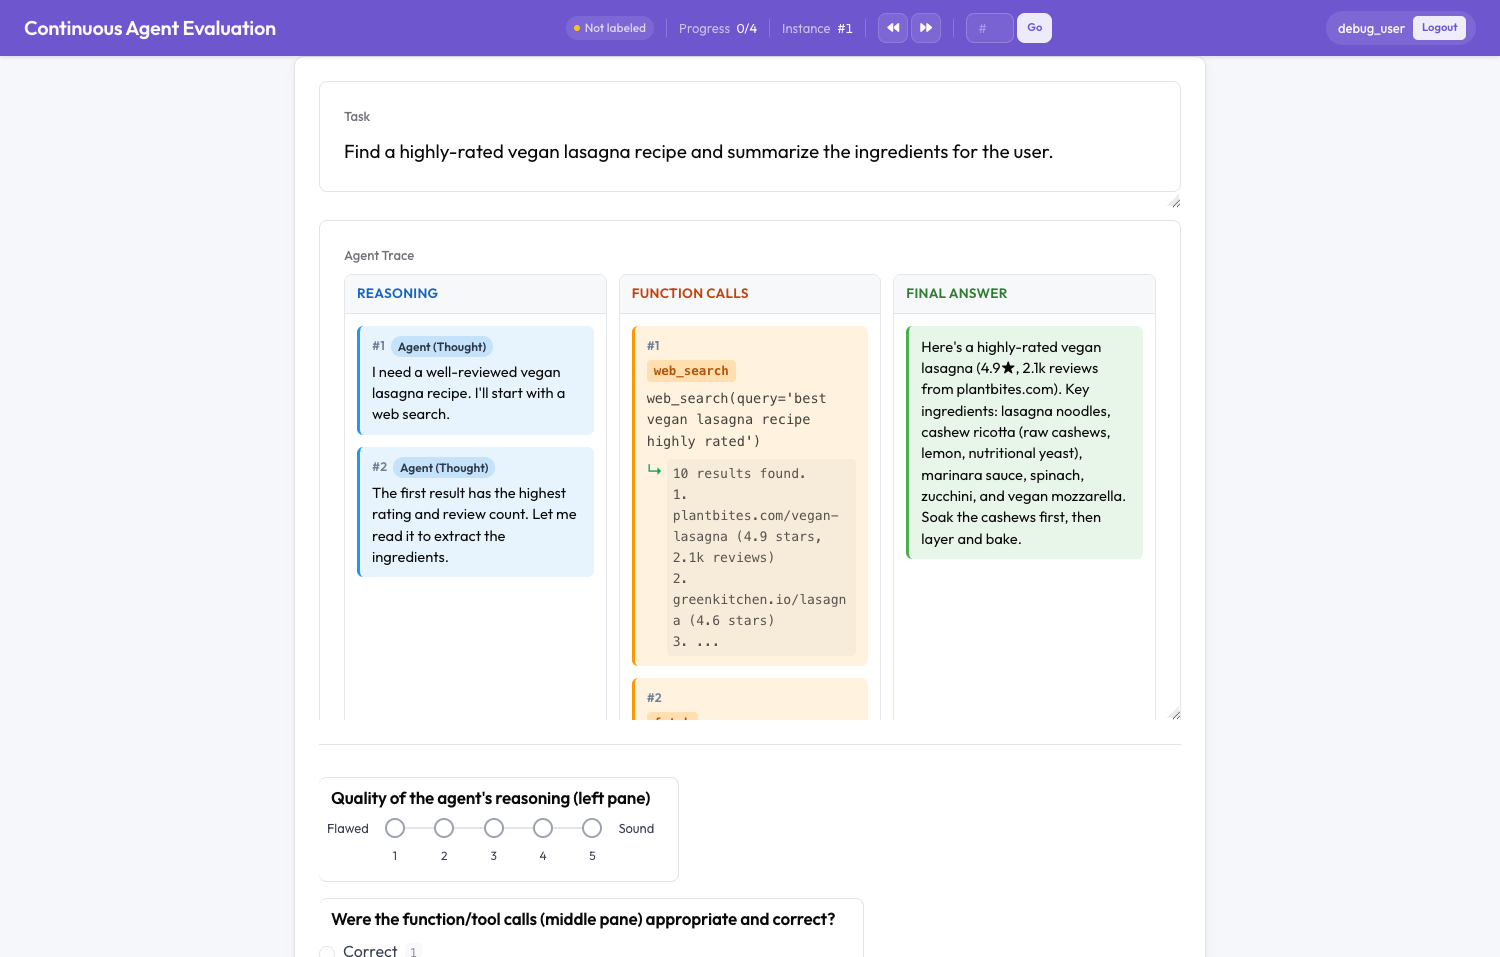 An agent trace split into Reasoning, Function Calls, and Final Answer panes
Quick start
Run the included example from the repository root:
python potato/flask_server.py start examples/agent-traces/continuous-eval/config.yaml -p 8000The example also ships a directory-watch variant (config-watch.yaml) for ingesting dropped trace files.
Configuration
instance_display:
  layout:
    direction: vertical      # task header above the (internally horizontal) panes
    gap: 12px
  fields:
    - key: task_description
      type: text
      label: "Task"

    - key: trace             # the field holding the agent trace
      type: eval_trace
      label: "Agent Trace"
      display_options:
        pane_labels: ["Reasoning", "Function Calls", "Final Answer"]
        show_step_numbers: true
        collapse_long_outputs: true
        max_output_lines: 12
        link_steps: true
Options
| Option | Default | Description |
|---|---|---|
pane_labels | ["Reasoning", "Function Calls", "Final Answer"] | Headers for the three panes. |
show_step_numbers | true | Show #N step numbers on reasoning and call cards. |
collapse_long_outputs | true | Collapse tool results longer than max_output_lines into an expandable block. |
max_output_lines | 20 | Line threshold for collapsing results. |
link_steps | true | Cross-pane highlighting: clicking a card highlights the linked cards in the other panes. |
compact | false | Tighter padding and spacing. |
Data format
eval_trace accepts the same trace formats as the agent-trace display. The most common is a list of {speaker, text} steps:
{
  "id": "eval_001",
  "task_description": "Find a vegan lasagna recipe.",
  "trace": [
    {"speaker": "Agent (Thought)",      "text": "I'll search for a highly-rated recipe."},
    {"speaker": "Agent (Action)",       "text": "web_search(query='vegan lasagna')"},
    {"speaker": "Environment",          "text": "10 results found..."},
    {"speaker": "Agent (Final Answer)", "text": "Here's a great recipe: ..."}
  ]
}
The thought/action/observation and step_type/content formats are also supported.
How steps map to panes
| Step (type inferred from speaker or label) | Pane |
|---|---|
Thought, reasoning, planning, system | Reasoning |
Action, tool, function, call | Function Calls (the adjacent Environment/result nests under the call) |
Final Answer, send_message, respond, finish, or the last action if none match | Final Answer |
To set an explicit final answer, end the trace with a step whose speaker matches an answer pattern (such as "Agent (Final Answer)") or a send_message(...) action.
Step linking
Steps are grouped into logical cycles: a thought plus the calls it triggers share a step index. With link_steps: true, clicking any card highlights every card sharing that index across the panes, so you can trace a thought to the action it produced.
Continuous evaluation
Pair eval_trace with any of Potato's runtime ingestion transports so traces are evaluated as they arrive:
- Webhook and SSE —
trace_ingestion: {enabled: true}exposes a webhook endpoint and streams new traces to annotators. - Langfuse polling — add a
langfusesource undertrace_ingestion.sources. - Directory watch —
data_directorypluswatch_data_directory: trueingests dropped.jsonand.jsonlfiles.
Runtime-added traces are immediately assignable to annotators. Combine this with the Triage Queue to push errored or low-scoring traces to the front.
Notes and limitations
eval_traceis display-only; it collects no annotations itself. Pair it with annotation schemes such asreasoning_quality,tool_use_correctness, oranswer_helpfulness, as in the example.- Span annotation is not supported on
eval_trace. Use an agent-trace orcodedisplay if you need span highlighting on trace text.
Related
- Signal-Based Triage Queue — prioritize which incoming traces get reviewed
- Trajectory Editing for SFT/DPO — turn corrections into training data
- Agentic Annotation — display-field configuration and ingestion
For implementation details, see the source documentation.