Labels With Error Bars: Item Response Theory for Annotation
Majority vote throws away most of what annotators told you. Item response theory gives every label a posterior probability and a sensitivity band.
Majority vote treats every annotator as equally reliable and every item as equally hard, and it reports a count instead of a probability. Item response theory (IRT) estimates each annotator's ability and each item's difficulty from the pattern of agreement alone, then reports every label as a posterior probability with a sensitivity band over the ability estimates, with no gold labels and no LLM. In Potato this is the psychometrics engine, and it runs live as annotations arrive.
Consider three annotators who label an item, two as sarcastic and one as sincere. Majority vote calls it sarcastic and moves on, and your dataset records that label with exactly as much confidence as an item where all three agreed. The count throws information away. The dissenter might be your most reliable annotator, or the item might be one that everyone finds hard, and neither fact survives the count.
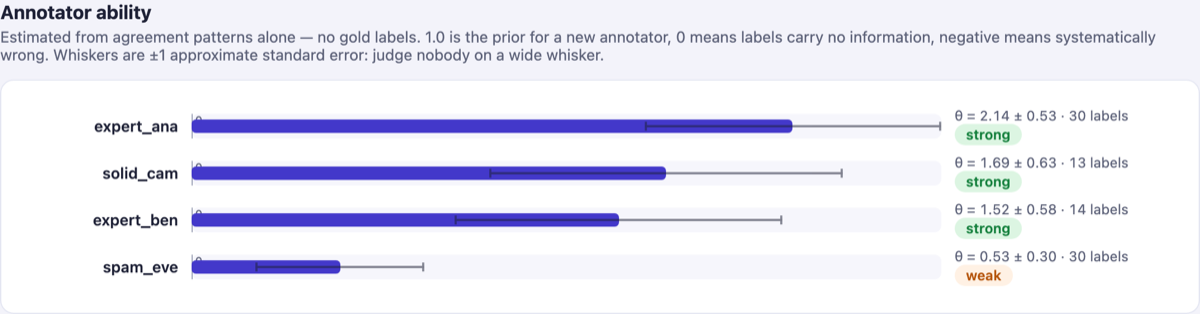 Annotator ability with standard-error whiskers
Item response theory and the GLAD model
Item response theory comes from psychometrics, where it was built to score standardized tests. A test tells you two things at once, how able each test-taker is and how hard each question is, and you can estimate both jointly from nothing but the response pattern because they constrain each other. A question that able students get wrong is a hard question, and a student who gets hard questions right is an able student. Annotation has the same shape. Annotators are test-takers, items are questions, and nobody has the answer key.
Potato fits a multiclass generalization of the GLAD model. The fit is deterministic, because expectation-maximization starts from the prior means with no random initialization, and by default Potato refits after every five new labels, so the estimates stay current while the study runs. It estimates three things together:
- the true label of each item, as a probability distribution
- each annotator's ability (θ), with a standard error
- each item's difficulty, and a per-item discrimination diagnostic
Posterior labels from the psychometrics engine
A psychometrics block in your config turns the engine on for one scheme:
psychometrics:
  enabled: true
  schema: sarcasm
  confidence_threshold: 0.95
  min_annotators_per_item: 2
The block alone gives you the analytics layer, and your export changes from this:
sarcastic (2 of 3 votes)to this:
sarcastic p = 0.94 [0.88 – 0.97]The probability is the model posterior, which weighs who voted rather than only how many. The bracketed range is its sensitivity band, the lowest and highest posterior the model gives when every annotator's ability estimate is shifted down or up by one standard error. The band has no stated coverage level, so read it as how much the label depends on the ability estimates and not as a 95% interval. Downstream, the posterior lets you train on soft labels, filter an evaluation set to items above a confidence floor, or treat low-probability items as genuinely ambiguous instead of quietly mislabeled. Disagreement stops being noise to be averaged away, the argument of disagreement is signal, not noise.
Annotator ability and its error bars
Ability is estimated from agreement patterns. A value of 1.0 is the prior for a newcomer, 0 means the annotator's labels carry no information, and negative means systematically wrong.
Every estimate comes with a standard error, and the standard error matters more than the point estimate does. An annotator with twelve labels has a wide whisker, and the dashboard draws it wide. Do not make personnel decisions from a wide whisker. The standard errors are approximate (Fisher information at the mode) and mildly optimistic by construction. Use them to keep from over-reading a number, never as grounds for firing someone.
For a simpler competence readout across any categorical scheme, MACE is the older tool and still a good one. MACE runs as batch analytics, while psychometrics sits in the assignment loop and acts on the study while it runs.
Item discrimination and codebook bugs
Alongside difficulty, the model estimates discrimination, which measures whether, on a given item, annotator ability correlates with agreeing with the consensus. Normally it does, because able annotators agree with the eventual answer more often, which is roughly what "able" means.
Strongly negative discrimination means your best annotators are systematically disagreeing with the crowd on that item. The likeliest explanation is that the guideline is ambiguous or wrong for that case and the careful annotators are the ones noticing, rather than that your best annotators suddenly became bad. Potato surfaces these items under "Likely codebook bugs." Review them early, because each flagged item points to a possible defect in the instrument, and a guideline fix changes every later label on items like it. Fix the guideline, then re-annotate, and a norming room is a good place to work through the list as a team.
Adaptive assignment by expected information gain
Fixed redundancy, the "three annotators per item, always" rule, spends the same amount on an item everyone agrees about as on an item that splits the team down the middle, which gets the allocation backwards. Psychometric assignment spends labels where they carry information:
assignment_strategy: psychometric
num_annotators_per_item: 4
psychometrics:
  enabled: true
  confidence_threshold: 0.95
  cost_per_judgment: 0.08
When an annotator asks for work under this config, Potato ranks the remaining items by the expected information gain of that specific annotator labeling that specific item. num_annotators_per_item: 4 caps each item at four annotators. An item stops being served before it reaches the cap once its posterior clears confidence_threshold and it has at least min_annotators_per_item annotators (2 by default), so an easy item can finish at two labels while a contested one gets up to four. The dashboard counts the judgments saved against that cap of four, and prices them if you set cost_per_judgment.
Two caveats apply before you turn adaptive assignment on:
- Cold start. Until enough labels exist, assignment falls back to random, because the model cannot separate ability from difficulty without overlapping annotators and does not act on estimates it cannot make. The dashboard shows a warming-up meter in the meantime.
- Batching. Ranking is freshest when queues are short. Handing each annotator a batch of 200 items dilutes the adaptivity, because the ranking was computed before most of those labels existed.
Choosing redundancy with the study designer
A fixed rule such as three annotators per item sets redundancy before any data show what the task needs. The study designer estimates it with a Monte Carlo simulation instead:
python -m potato.psychometrics.design --items 500 --accuracy 0.75 \
    --classes 3 --target-ci 0.10 --cost 0.08
The designer prints one row per redundancy level:
ann/item   alpha     95% interval   width  majority acc  judgments       cost
       2   0.392 [ 0.330,  0.439]   0.109         0.751       1000      80.00
       3   0.388 [ 0.338,  0.431]   0.093         0.864       1500     120.00  <- recommended
The recommendation is the cheapest redundancy whose 95% interval on Krippendorff's α is still narrower than your target. The --accuracy input is the one you should measure with a small pilot rather than guess. The same calculation runs in your browser if you would rather not install anything.
Limits of the psychometrics model
The model has three limits:
- It models single-choice categorical schemes,
radioandlikert. Multi-select is not modeled. - It needs overlapping annotators. If every item is labeled by a different person, there is no agreement structure to learn from, and the model will tell you it is still warming up.
- With one annotator, or with unanimous labels everywhere, the fit is degenerate by design, and that degenerate fit is the correct behavior.
To start, add the first psychometrics block above to a study where annotators overlap on a radio or likert scheme, then check the ability whiskers and the "Likely codebook bugs" list once the warming-up meter clears.
Further reading
- Psychometrics engine, the full configuration reference
- Truth Serum, the other way to score quality with no gold labels
- How many annotators do you need?
- Aggregating crowd labels, covering Dawid–Skene and related models
- Inter-annotator agreement
References
Jacob Whitehill et al. (2009). Whose Vote Should Count More: Optimal Integration of Labels from Labelers of Unknown Expertise. Advances in Neural Information Processing Systems 22. https://papers.nips.cc/paper_files/paper/2009/hash/f899139df5e1059396431415e770c6dd-Abstract.html